Infrastructure Observability, Explained

Every incident has
a root cause.
We find it first.

Kllyroo watches your servers, containers, and Kubernetes clusters — then tells you exactly what broke, what it's causing, and how to fix it. 223 built-in detection signatures. Predictive alerts before things tip over. Zero guessing.

SELF-HOSTED OR MANAGED · LINUX & WINDOWS AGENTS · PILOT IN UNDER A DAY
Kllyroo server overview with CPU graph and server info
223root-cause signatures, 20+ stacks
1agent — Linux & Windows, zero code changes
5notification channels built in
0extra tools for SSH session recording
The Platform

Nine capabilities. One agent.

Everything below runs from a single lightweight agent — no sidecars, no separate collectors, no extra bill per capability.

Asset Types

Every capability, applied to what you actually run.

The nine capabilities above aren't asset-specific — here's how they come together for each thing Kllyroo watches.

Causal AI

Correlation, not coincidence.

Most tools show you every alert that fired. Kllyroo asks a harder question first: which of these actually caused the others? A hand-curated causal model — database exhaustion cascading to application timeouts cascading to gateway errors — turns a pile of alerts into one clear incident.

  • Deterministic cause → effect rules, not a black-box score you have to trust blindly
  • One incident, one root cause, one fix — instead of paging three different owners
  • Every correlation ships with the reasoning attached, so your team learns the pattern too
See how the correlation engine works →
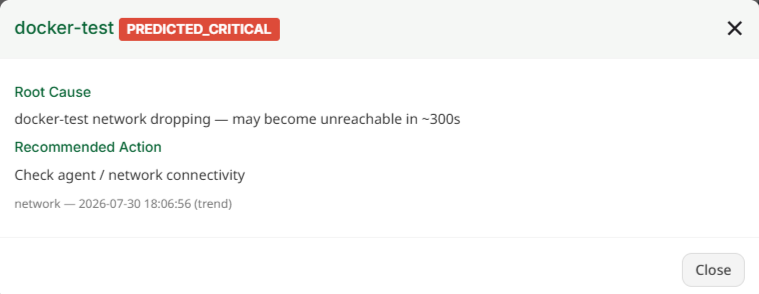
Kllyroo predicted-critical alert showing root cause and recommended action
Kubernetes Monitoring

Your clusters, in the same dashboard.

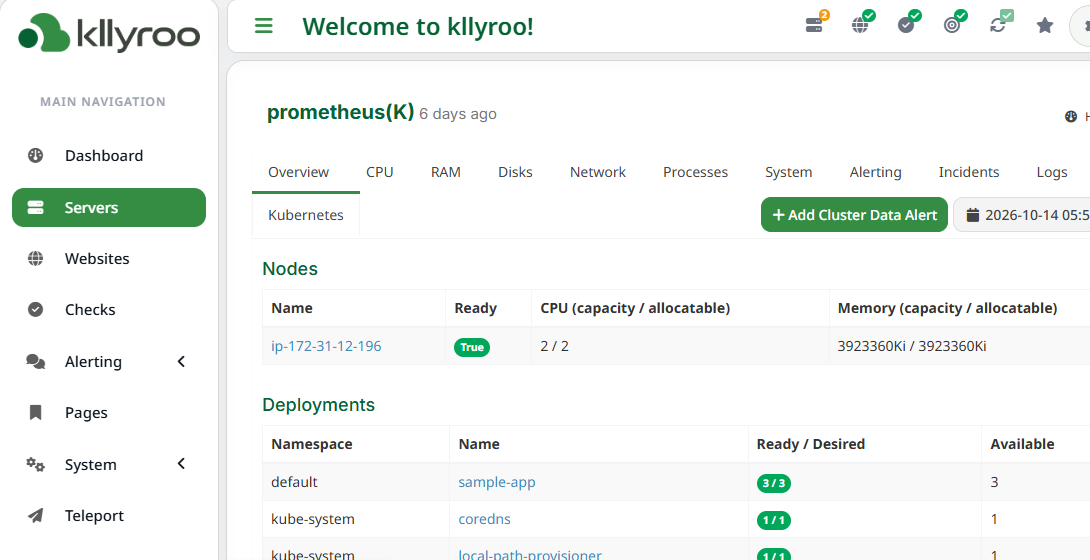
No in-cluster operator to install or upgrade — the same lightweight agent that watches your hosts polls the cluster it runs alongside.

Nodes, deployments, and pods — alerted like everything else.

Kubernetes gets the same alerting and incident model as every other asset type: not-ready nodes, degraded deployments, pod restarts, and "no data" detection when the agent stops hearing from the cluster at all — each with its own incident trail, not a silent gap.

  • Node, pod, and deployment status tracked continuously via the agent's own cluster access
  • Restart-rate anomaly detection on pods — baselined per pod, not a fixed global count
  • Cluster-wide "no data" alerting, so a dead connection pages you instead of going quiet
See the full Kubernetes alerting model →
Kllyroo Kubernetes view with nodes and deployments
Container Intelligence

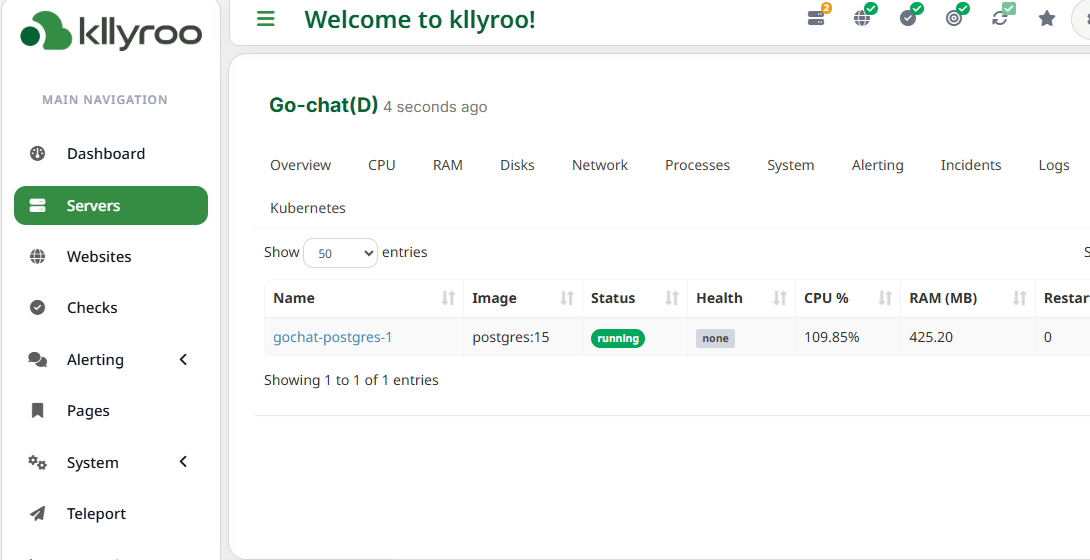
Docker, watched the way a human would.

Every container's status, health check, CPU, and memory — tracked over time, alertable, and correlated with its own log stream. No separate agent, no extra install.

  • Lifecycle detection: OOM-killed, crash-looped, image changed
  • Per-container history graphs with a date-range filter, same as hosts
  • Alerts on CPU, memory, "not running," and "unhealthy" — each with its own incident trail
  • Restart-rate anomaly detection — flags a container restarting more than its own normal cadence, not a fixed global threshold
See full container monitoring details →
Kllyroo container list with status, health, CPU and memory
Predictive Alerts

A warning before the page fires.

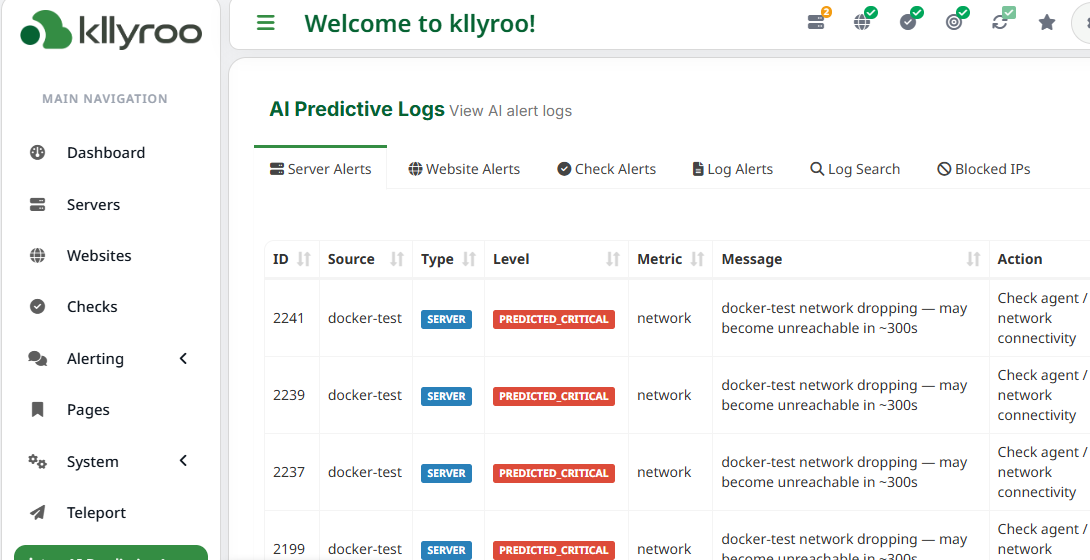
Kllyroo fits a trend line to your own recent history, then forecasts when CPU or memory will cross its threshold — a short-range, "about to tip over" warning, not a guess. Every metric also carries its own baseline, so a spike gets judged against what's normal for that specific server or container, not a fixed number.

  • ETA-to-threshold prediction for CPU and memory, on hosts and containers
  • Self-learning baselines (EMA with outlier clipping) — no manual thresholds to tune
  • Every predictive alert ships with a plain-language reason, not just a number
See the prediction methodology →
Kllyroo AI Predictive Logs table of predicted alerts
AI Investigation

Ask your infrastructure a question.

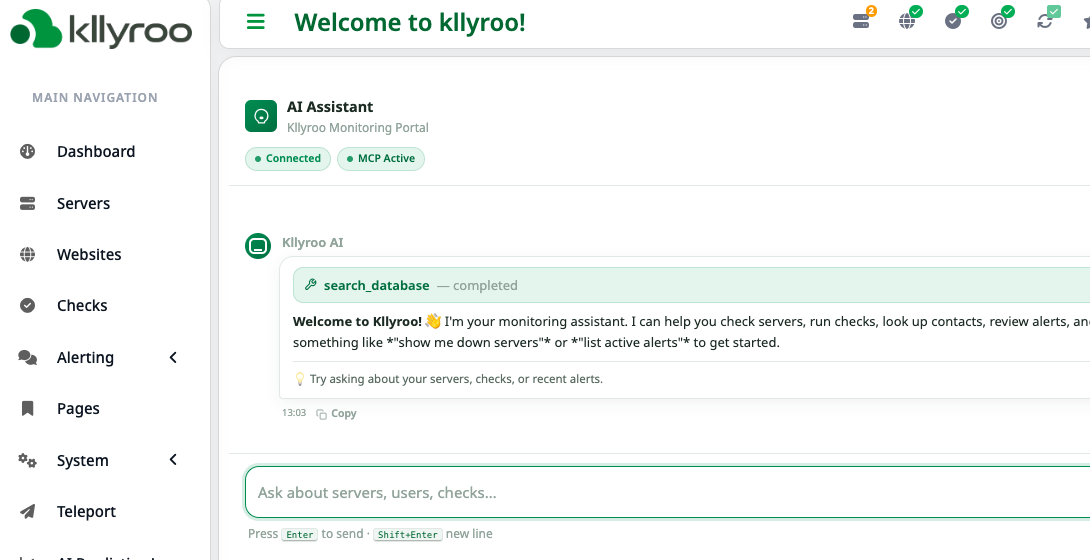
Kllyroo's chat assistant calls real tools against your live data — server status, alert history, log search — instead of guessing from a prompt. Ask in plain language, get an answer grounded in what's actually happening right now.

  • "Which servers are down right now?" — answered from live status, not a stale snapshot
  • Unrecognized log lines get an LLM-generated explanation instead of being dropped silently
See what the assistant can and can't do →
Kllyroo AI assistant answering a question about infrastructure
Session Recording

Every SSH session, recorded and searchable.

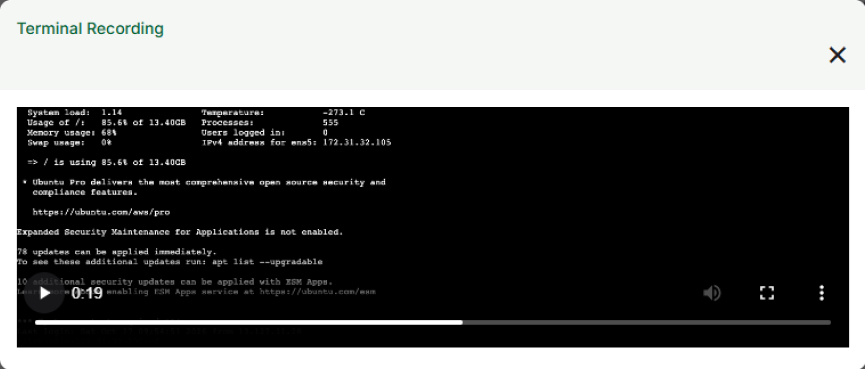
Built-in terminal recording and command history for every SSH session through Kllyroo — the kind of audit trail teams usually pay for a separate tool (Teleport, StrongDM) to get.

  • Full-session video playback, indexed by server, user, and time
  • Command search across every recorded session — find "who ran that" in seconds
See recording & retention details →
Kllyroo terminal session recording playback
Security Detection

Catches the scan, not just the breach.

40 security signatures watch your web-facing logs for the exploit attempts that precede a real compromise.

Real exploit patterns, not keyword guessing.

Path traversal, SQL injection, SSRF against cloud metadata endpoints, Log4Shell and Spring4Shell probes, webshell uploads, exposed .env/.git/composer.json files — detected from the request pattern itself, with the CVE and the fix.

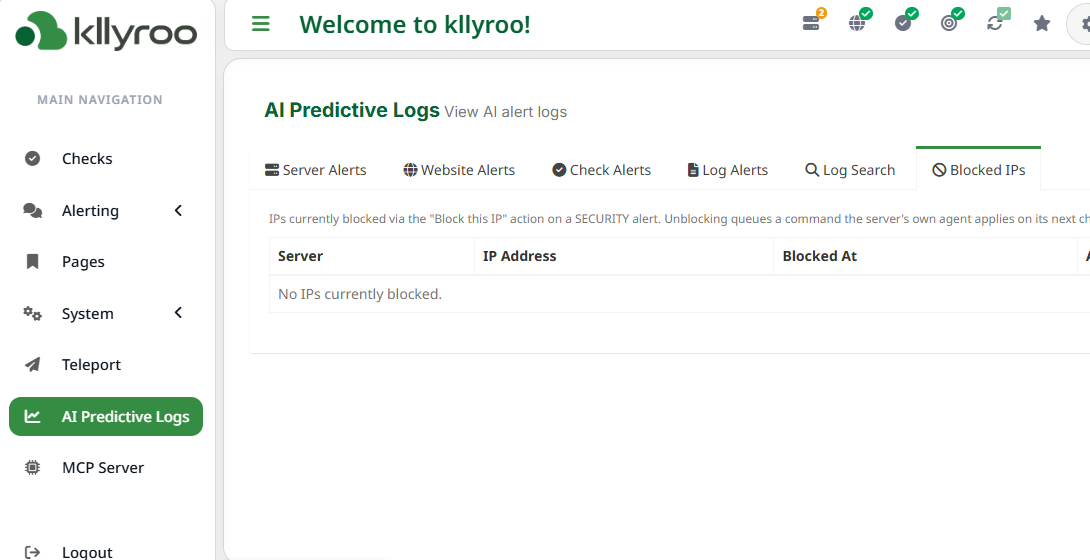
  • Block the source IP straight from the alert — queued for admin approval, applied by the agent on that server, never fully automatic
See all 40 signature categories → See how the human-approval queue works →
Kllyroo Blocked IPs page
Fits Your Workflow

Alerts where your team already is.

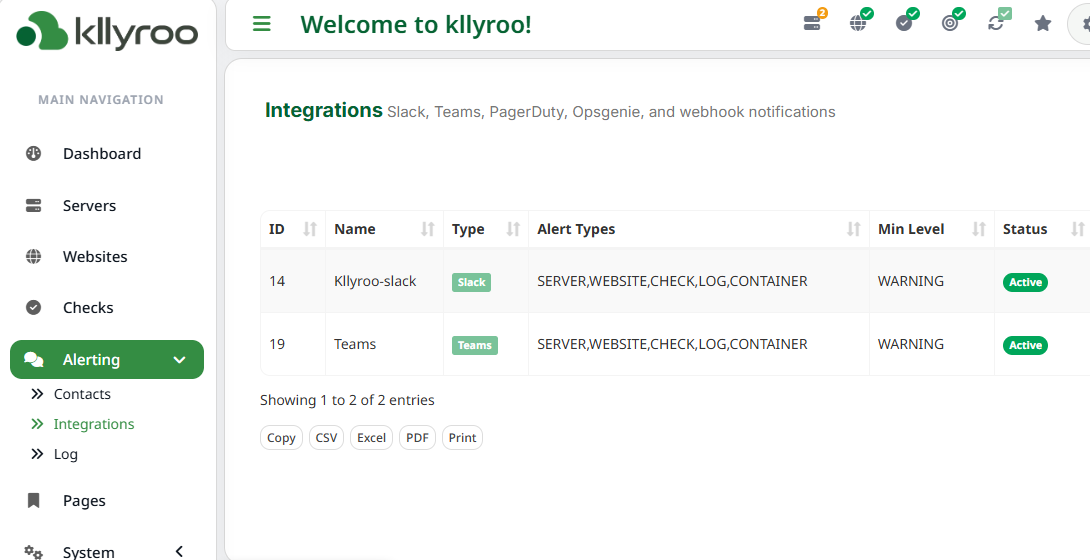
Route by severity, by asset, or by integration — every notification carries the same root-cause explanation you see in the dashboard.

Slack
Microsoft Teams
PagerDuty
Opsgenie
Generic Webhook
Email & SMS
Kllyroo alert integrations for Slack and Teams
See routing rules & how notifications tie to incidents →
How It Compares

Not trying to out-feature Datadog.
Trying to out-explain it.

The enterprise APM giants have a decade of integrations we don't. What we built instead: deeper root-cause explanations per alert, and a few things they don't do at all.

CapabilityDatadog / New RelicZabbix / NagiosKllyroo
Root-cause signature per alertGeneric anomaly scoreThreshold only223 specific signatures
Cause → effect alert correlationYesNoYes
Built-in SSH session recordingNoNoYes
AI chat grounded in live dataRecent, genericNoYes
Kubernetes monitoringYes, in-clusterLimitedYes, agent-based
Predictive ETA / anomaly alertsYesNoYes
Code-level APM / tracingYesNoNot yet
Where We Stand

What we're good at today — and what we're not, yet.

A monitoring tool should be honest about its own blind spots. Here's ours, plainly.

Built & Production-Ready

  • 223 root-cause signatures across web, app, DB, and queue layers
  • Cause → effect alert correlation, not just co-occurrence
  • Docker container monitoring — lifecycle, health, history, alerts
  • Kubernetes monitoring — nodes, pods, deployments, restart-rate & no-data alerting
  • Predictive ETA and baseline anomaly detection for CPU & memory
  • Human-approved automated response — IP blocking & agent updates, one click
  • Slack / Teams / PagerDuty / Opsgenie / webhook notifications
  • Built-in SSH session recording & searchable command history
  • AI chat grounded in live server/alert data via tool-calling

On The Roadmap

  • Predictive ETA & anomaly detection for Kubernetes pods (metrics collection is categorical today)
  • Code-level APM & distributed tracing
  • Active TLS certificate expiry checks
  • Cloud provider API integrations (AWS / Azure / GCP)
Get In Touch

Reach us directly.

Offices in India and the US — reach out and we'll get back to you.